


YNU Global Input-Output Table (YNU-GIO Table)
Real Global Input-Output Database
The YNU-Global Input-Output (GIO) Tables are constructed by Nagendra Shrestha and Kiyotaka Sato, Department of Economics, Yokohama National University. The “Real” Global Input-Output Tables (2005 base year) have been released in September 2023, where annual tables are available for the period from 1995 to 2022 (updated in March 2026). The Real GIO Tables have 30 countries (10 Asian countries), 16 industrial classification (14 manufacturing industries), and 6 final demand categories. The Real GIO Tables are estimated from various data sources, including the 2025 version of OECD Inter-Country Input-Output (ICIO) Tables, industry-specific producers price (or wholesale price) indices used for “Industry-Specific Nominal and Real Effective Exchange Rates of 25 Countries Worldwide” at the Research Institute of Economy, Trade and Industry (RIETI), consumer price indices, and exchange rates collected from UNSD, National Account Main Aggregates, and National Statistics, Republic of China (Taiwan).
The following table (reorganized from the 2022 Real GIO Table) represents the Inter-Continent Input-Output Table for 2022 in real terms with three continents, three industrial classifications, and a final demand category.
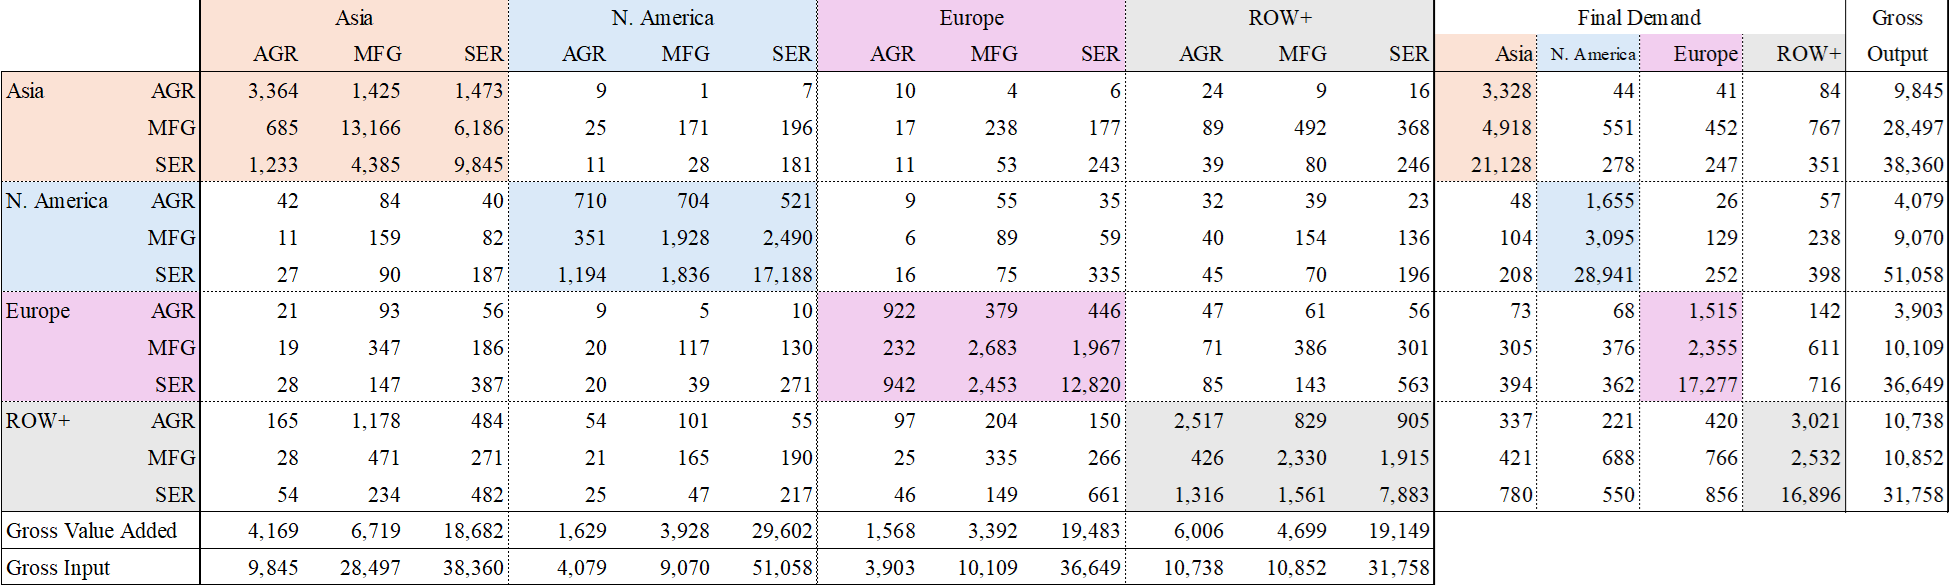
Note:
1. Base year: 2005
2. Unit: Billion US$
3. ROW+: Australia, New Zealand, and Rest of the World
4. AGR: Agriculture and Mining, MFG: Manufacturing, SER: Services
Details of conversion methods from nominal values into real values, compilation of Real GIO Tables, and other necessary information are presented and discussed in Shrestha (2026). The Real GIO Tables can be used for free only for educational and research purposes. Please cite both the CESSA website as the data source and the following paper for acknowledgements.
● Shrestha, Nagendra, 2026,"Compilation of Real Global Input-Output Tables," CESSA Working Paper, 2026-03.
YNU-GIO in Excel Format
1995-2022
All Files1995
RGIOv2026_1995_Base20051996
RGIOv2026_1996_Base20051997
RGIOv2026_1997_Base20051998
RGIOv2026_1998_Base20051999
RGIOv2026_1999_Base20052000
RGIOv2026_2000_Base20052001
RGIOv2026_2001_Base20052002
RGIOv2026_2002_Base20052003
RGIOv2026_2003_Base20052004
RGIOv2026_2004_Base20052005
RGIOv2026_2005_Base20052006
RGIOv2026_2006_Base20052007
RGIOv2026_2007_Base20052008
RGIOv2026_2008_Base20052009
RGIOv2026_2009_Base20052010
RGIOv2026_2010_Base20052011
RGIOv2026_2011_Base20052012
RGIOv2026_2012_Base20052013
RGIOv2026_2013_Base20052014
RGIOv2026_2014_Base20052015
RGIOv2026_2015_Base20052016
RGIOv2026_2016_Base20052017
RGIOv2026_2017_Base20052018
RGIOv2026_2018_Base20052019
RGIOv2026_2019_Base20052020
RGIOv2026_2020_Base20052021
RGIOv2026_2021_Base20052022
RGIOv2026_2022_Base2005Real GIO Database V2026 (Supplementary Information)